CO2 Emissions – Society Real Problem
Short Introduction
As it is generally known air pollution might be caused by the presence of several types of pollutants in the atmosphere, having also different origins. It can cause serious effects on the populations (public health, man-made constructions) and also have a hazardous effect on the environment. In most cases, oil pollution and garbage are more easily recognized since it is a visible type of pollution. On the other hand, air pollution lacks visibility. Nevertheless, it is a problem that cannot be ignored anymore.
Air pollutants are substances that are directly harmful to human beings. Their impact decreases with the distance to the source. They have the particularity of modifying the properties of the atmosphere (cases of the greenhouse gases (GHG) or ozone depleting substances). Among the origins and types, they can be classified in primary ou secondary pollutants. Air pollutants can be originated by natural processes, where chemical and particulate matter are released (case of volcanoes, forest fires) or be originated by human activity, such as the case of production of gases and chemicals released to the atmosphere (NOx, halogens, SOx, CFC’s and C based gases such as CH4, CO, CO2 and VOC).
Climate system can be defined as the average weather over a long-term period of time, or the combination of numerous interactions and retroactions between various complex subsystems: the atmosphere, oceans, land, human beings and their activities.
The GHG Effect
One effect that has influenced climate change more significantly is the GHG effect. GHG effect results from the interaction of various mechanisms affecting the incoming and outgoing energy from the sun. Any change in GHG concentration affects the retention of solar heat and consequently warms the atmospheric layers. Some components in the air enhance the warming effect while others diminish it.
The concentration of GHG tends to increase due to human activity (fossil fuel use).
On Figure 2 we can see the variation of concentration of one of the most hazardous gases during the years, carbon dioxide CO2 and also the increase of temperature on the earth surface due to its effect.
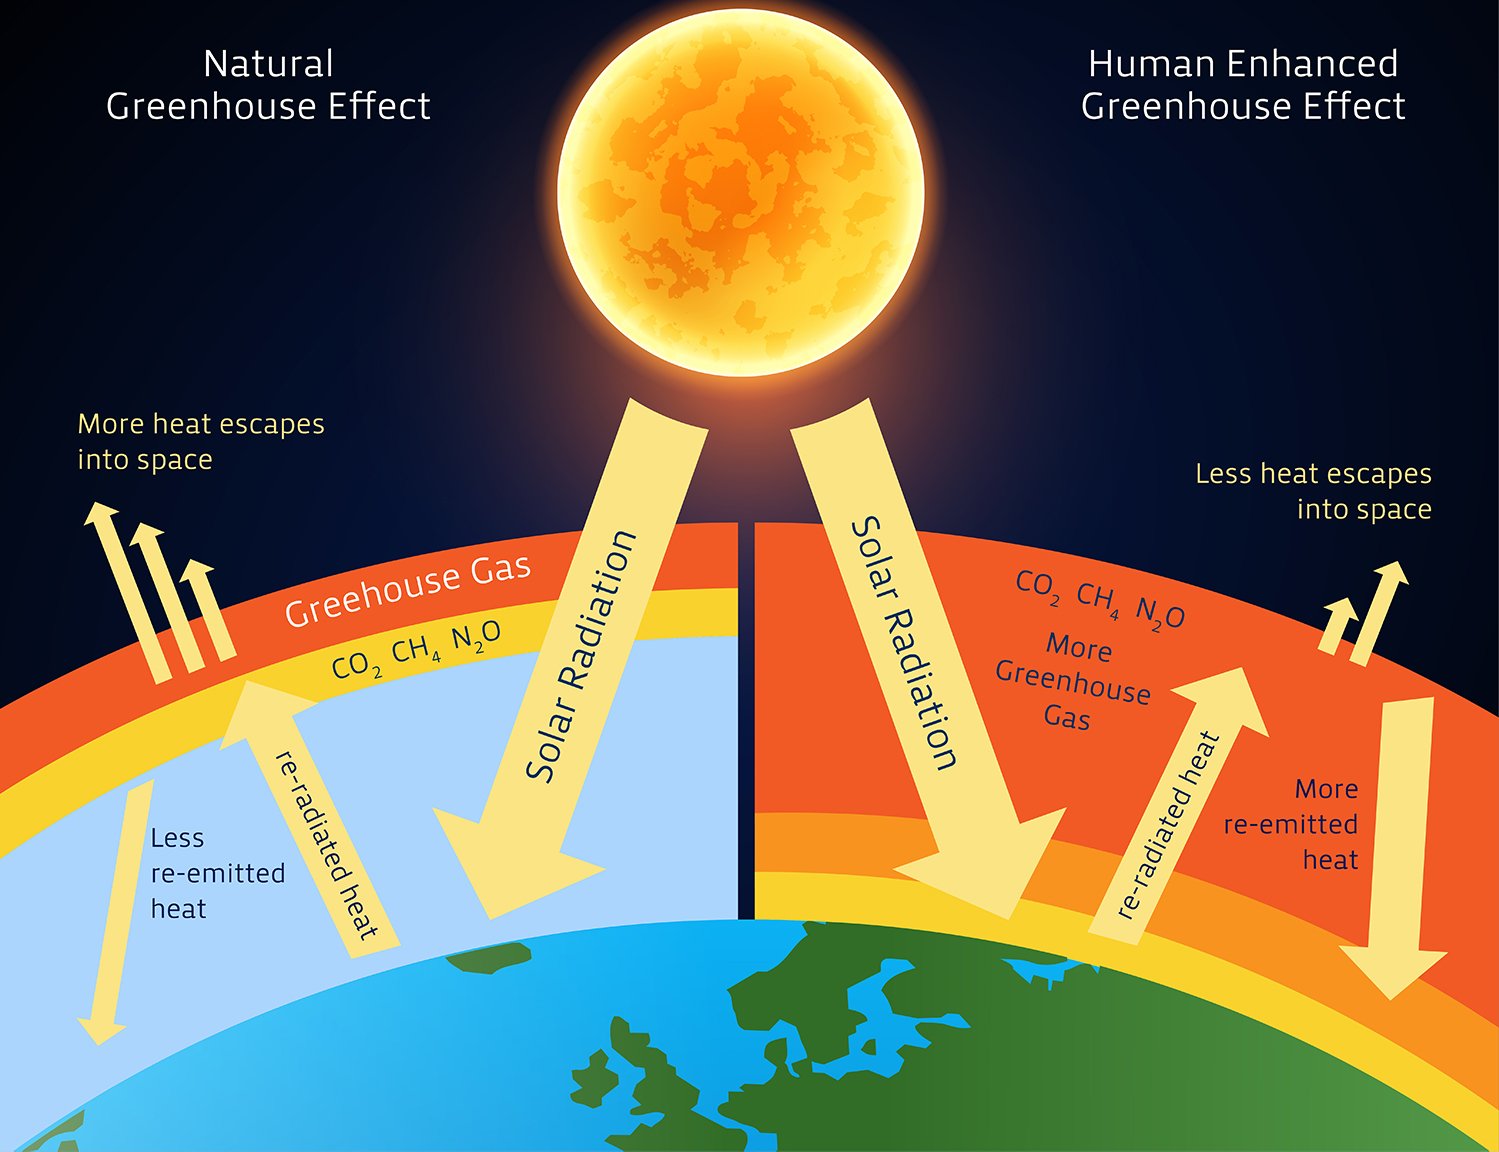
Figure 1 – Schematics of the Greenhouse Gas Effect
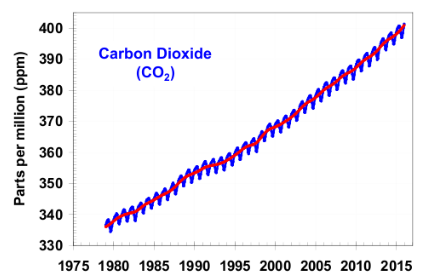
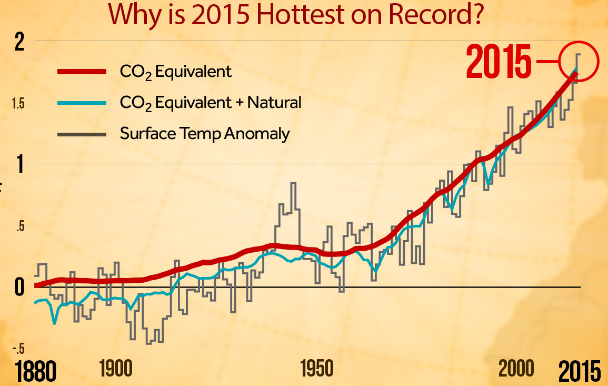
Figure 2 – Variation of CO2 concentration over the years (on the left) and the impact on temperature surface (on the right).
The Carbon Dioxide (CO2)
Carbon Dioxide is one of the most harmful global warming gases due to the amounts released and its lifetime in the atmosphere. CO2 main sources are derived from Fossil Fuels burnt for electricity, transportation, industrial activity and household uses.
Carbon dioxide has also a direct impact on oceans and marine life (e.g.: dilatation and sea-level), it can accelerate erosion, affect oceans properties, cause oceans acidification and modify ecosystems and its habitats.

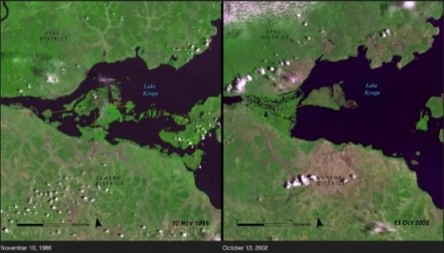
Figure 3 – Climate change effects caused by CO2 effect: On the left, the case of Lake shrinkage on central Asia and Flood on Uganda (on the right).
The Maritime Sector and Air Pollution
Since the Industrial Revolution, there was a need to use extensive and more immediate types of energy to operate engines and machines. The solution passed by the use of combustion fossil fuels (fuel oil for internal combustion engines, marine diesel engines). With industrialization, the increase of activities and expansion of the transport network increased the energy demand, and thus fossil fuel.
The increase of commerce and trading lead to the intensification of transport connections. Since there was a need to connect internationally, there was a boom in means of transportation, such as shipping and air transportation.
We reach the conclusion that we can no longer imagine our world without a transportation system, but undoubtedly it is still very dependent on fossil fuels.
More specifically in the maritime sector, it has been possible to observe an increase on the number of vessels over the past few decades.
Associated with the increase of shipping activity came the seaborne trade and shipping emissions that kept rising throughout the last century, with projections indicating that it shall double again by 2030. Studies released by the IMO indicate that CO2 emissions from international maritime transport to the Union increased by 48% between 1990 and 2007.
The increase of pollution (due to industrialisation) made governments initiate mitigation actions. The Kyoto Protocol clearly identified the responsibility of specialized agencies in charge of air and sea transportation.
The International Civil Aviation Organization (ICAO) and the International Maritime Organization (IMO) are required to pursue the objectives and intentions defined by the United Nations.
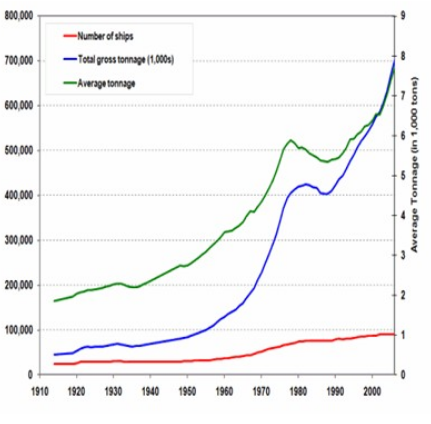
Figure 4 – Fleets evolution over the years (Source Lloyd´s Register-World Fleet Statistics).
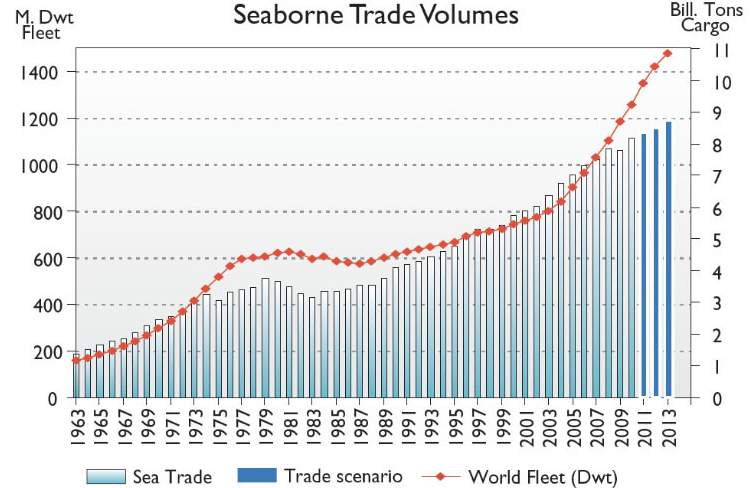
Figure 5 – Emissions from Shipping activity.
The IMO Actions
IMO, representing the shipping community, developed its own regulatory framework, demonstrating its concern regarding the emissions issue. The Commission and the Member States have set a target for the EU in 2030 to reduce GHG emissions by at least 40% compared to 1990.
According to IMO data, specific energy consumption and CO2 emissions from ships can be reduced by up to 75% by implementing operational measures and using existing technologies. The best option for reducing CO2 emissions from maritime transport is the creation of a monitoring, reporting and verification system (MRV) for CO2 emissions.
The EU MRV Legislation
These MRV measures that were implemented on 2016 should enable emissions to be reduced by up to 2%, and reducing aggregate net costs by around 1.2 billion € by 2030.
The implemented measures will have a substantial impact in a sector that until very recently was the only mean of transportation that was not included in the Union’s commitment to reduce GHG emissions. This set of rules will be applied to:
- big pollutants, namely ships with 5000 GT or higher;
- used for commercial purposes (carrying passengers or cargo);
- regardless of the flag or country of the shipowner.
Regulation EU 757/2015 and EU 2072/2016 lay down rules for the accurate monitoring, reporting and verification of carbon dioxide (CO2) emissions and of other relevant information from ships arriving at, within or departing from ports under the jurisdiction of a Member State, in order to promote the reduction of CO2 emissions from maritime transport in a cost-effective manner.
These rules have a legal and dissuasive impact since in case of non-compliance there is a possibility of expulsion for the vessel that fails to comply for two or more consecutive reporting periods with monitoring and reporting requirements.
Ship owners in order to comply with these new set of regulations should according to regulation EU 2015/757 Annex 1 verify CO2 emissions by one of the following ways:
- Method A: Bunker Fuel Delivery Note (BDN) and periodic stock takes of fuel tanks;
- Method B: Bunker fuel tank monitoring on board;
- Method C: Flow meters for applicable combustion processes;
- Method D: Direct CO2 emission measurements.
It is important to indicate that any combination of these methods, once assessed by the verifier, may be used if it enhances the overall accuracy of the measurement. In order to determine the CO2 emission by the mentioned methods, in some cases, there is a need to convert fuel measurement (in tonnes) to CO2 emitted (in tonnes of CO2). That can be achieved by knowing the emission factor of each relevant fuel and use equation EQ.1:

For the most used fuel types, such as Heavy Fuel Oil (HFO) and Marine Diesel Oil (MDO), the emissions factors are respectively: 3,114 tonCO2/ton Fuel and 3,206 tonCO2/ton Fuel.
Method A
If a company chooses Method A it will take into consideration the quantity and type of fuel as defined on the BDN combined with periodic stocktakes of fuel tanks based on tank readings.
The fuel consumed between two ports of call can be determined by knowing the exact amount of fuel at the beginning of the period, adding the bunkered fuel and subtract the available amount at the end of the period and any possible de-bunkered fuel.
For the fuel used during a period, the fuel type and the sulphur content need to be specified.
There are cases in which this method should not be used, for example when BDN is not available on board ships, especially when cargo is used as a fuel (e.g.: liquefied natural gas (LNG) boil-off). The periodic stocktake of fuel tanks on-board is based on fuel tank readings. It uses tank tables relevant to each fuel tank to determine the volume at the time of the fuel tank reading. The uncertainty associated with the BDN shall be specified in the monitoring plan. Fuel tank readings shall be carried out by appropriate methods such as automated systems, soundings and dip tapes. The method for tank sounding and uncertainty associated shall be specified in the monitoring plan.
In cases where the amount of fuel in tanks is determined in volume (e.g. Cubic meters), the company shall convert to mass by using the actual density values (determined by onboard measurements, by using the value indicated in the BDN, or recurring to measured values conducted in an accredited fuel test laboratory).
Method B
In alternative, companies can choose, Method B which is based on fuel tank readings for all fuel tanks onboard. The tank readings shall occur daily when the ship is at sea and each time the ship is bunkering or de-bunkering. The cumulative variations of the fuel tank level between two readings constitute the fuel consumed over the period. Once more, fuel tank readings shall be made by using appropriate methods, such as automated systems, soundings and dip tapes. The uncertainty associated with the method must be specified in the vessel’s monitoring plan.
As seen to Method A, if the readings are effectuated in volume, the values can be determined by knowing the fuel actual density.
Method C
Companies can also monitor fuel consumed in a certain period by using Flow meters for applicable combustion processes (Method C). The method is based on measured fuel flows on-board.
The data from all flow meters linked to relevant CO2 emission sources (main engines, auxiliary engines, burners, boilers) shall be combined to determine all fuel consumption for a specific period. If using this method in the vessel monitoring plan should be specified, the calibration methods used and the uncertainty associated with the equipment.
Method D
Besides the previous methods, the company can also measure directly the CO2 emissions onboard (Method D). This measurement can be used for voyages and for CO2 emissions occurring in ports located under the jurisdiction of a Member State.
CO2 emitted must include the CO2 emitted by the emissions sources onboard (main engines, auxiliary engines, gas turbines, boilers and inert gas generators).
This method, unlike the previous ones, gives the company a direct value of the CO2 impact made by the vessel, there is no need of converting fuel consumption using emission factors. This method is based on the determination of CO2 emission flows in exhaust gas stacks (funnels) by multiplying the CO2 concentration of the exhaust gas with the exhaust gas flow.
The vessel must specify both the calibrations associated with the measuring equipment and the uncertainty of the readings in the monitoring plan.
The MRV and IMO DCS
In terms of the MRV process by this time of the year (October 2018) and until 31 December 2018, companies are gathering information about CO2 emissions, fuel consumption and also vessels activity data (such as transport work, cargo carried, distance travelled). This information is to be indicated in the company Emissions Report and shall be sent to verification by an independent accredited entity via electronic communication and using a standardized format developed by the Organization.
With the beginning of 2019, the IMO-DCS will also enter also in force, affecting the shipping industry. The new regulation focus on reporting fuel oil consumption data for each type of fuel used on board.
We can then say that a first step is being made and that these amendments consist of an approach in order to enhance a decision making on measures regarding the data and the analysis made. With the information gathered by either MRV System and IMO-DCS, organizations will have a more exact idea of the impact of shipping industry on CO2 emissions to the atmosphere, and could then act more properly in order to avoid its effect on the societies daily basis.


