Case Studies and Ship Performance Monitoring
How do you define what needs attention? It will be the operating parameters that imply operational costs or people’s safety and investments. By setting maximum values for heavy oil, diesel, or lubricating oil consumption, we are limiting values above or below which we do not accept as good for continued ship operation.
Thus, given the strong impact that heavy fuel oil consumption has on operating costs, this becomes one of the key factors to consider when assessing the energy performance of ships. Operating variables, such as specific consumption, of the various onboard power conversion equipment are considered KPI, or Key Performance Indicators.
- SFOCb: Brake Specific Fuel Oil Consumption (g/kWh);
- SFOCe: Electric Specific Fuel Oil Consumption (g/kWhe);
- EETI: kWh/ Ton x Mn;
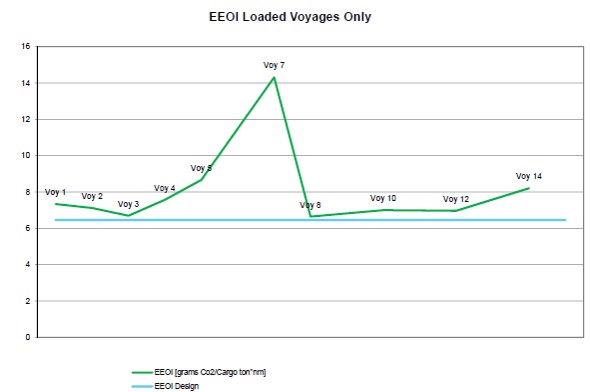
- EEOI: Ton CO2/ Ton x Mn;
- Propeller Efficiency;
- Power boost;
- Propeller delivered power as a function of ship speed;
- Main engine efficiency;
- SSC: Specific Steam Consumption (kg vapor/ kWh);
- Boiler Efficiency: %
- COP – Coefficient of Performance: %
- HFO Consumption by Distance travelled: Ton/Mn;
- kWh/Mn.
The above-mentioned set of variables establish so-called filters, which have to be defined numerically before implementing data analysis.

Propeller curve Power = F (Vs) unfiltered data

Propeller curve Power = F (Vs) filtered data 75% of the left figure data were discarded
- Influence of currents and winds on data filtering

Propeller speed data as a function of ship speed unfiltered data

Propeller speed data as a function of ship speed Filtered data
- PR performance ratio
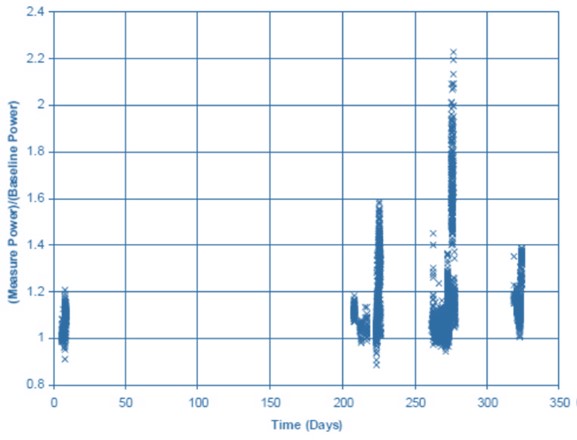
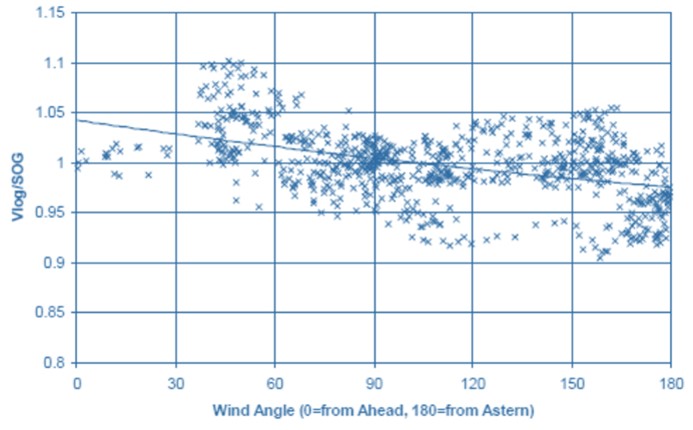
Only after the filters are established can the raw data be processed, refining them in various steps and with different objectives of identifying deficiencies in the ship’s different energy systems. The full coverage of all power conversion systems, although possible, becomes economically unfeasible beyond a certain level, given the cost of the transducers, but also due to the number of data to be processed, and mainly to be digested because parses the data.
It was with such an aim of handling raw data automatically that the BOEM-S “Blue Overall Energy Monitoring System” program was born. BOEM-S receives the raw data, filters the data based on the defined operational filters, analyses the data statistically, and represents the KPIs graphically and objectively, alerting the personnel involved with the analysis of the ship’s performance without is about carried with too much data.


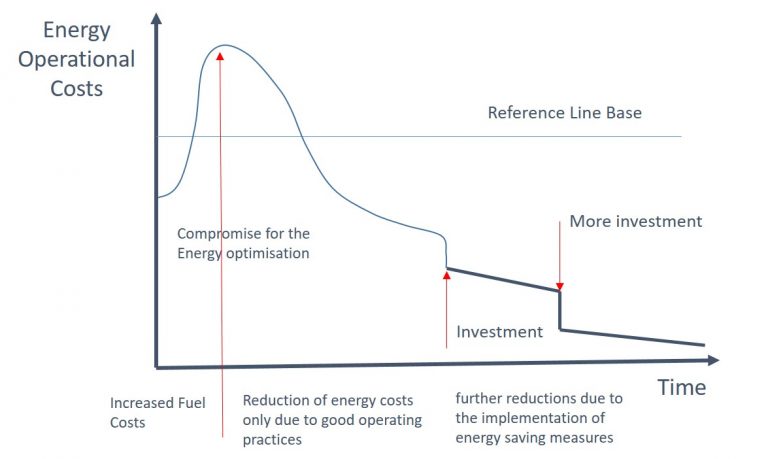
The following graph shows the action timeline from the moment the process of implementation of a performance and energy monitoring system begins, until the implementation of energy rationalization measures and the appropriate performance improvement actions.
- SFOC Main and Auxiliary engines – Minimise
- Shaft alternator / Turbo alternator – Maximise
- Electrical power load – Minimise
- Boiler operation – Optimise
- Draft and Trim – Optimise
- Voyage management – Optimise
- Course management Autopilot – Optimise
- General losses of energy – Minimise
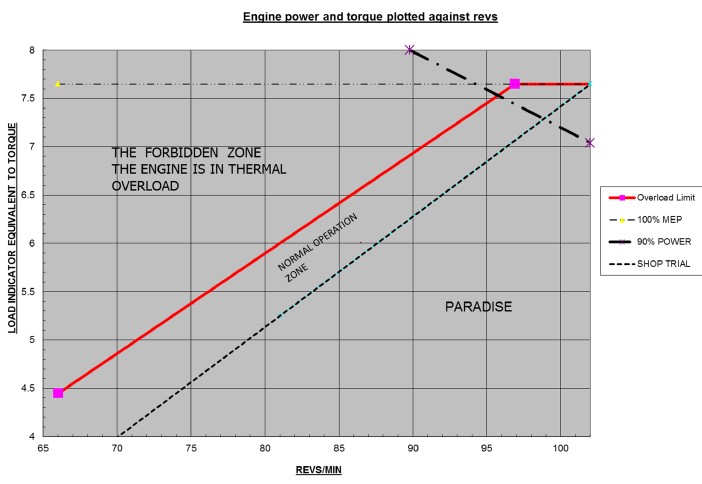
- Main Engine Optimised Operation
By gathering information and studying the operation of the Main Machine, it is possible to identify normal operating zones and optimize operation to achieve optimal consumption and performance, resulting in very significant savings for the shipowner, thereby reducing operating costs and increasing competitiveness.
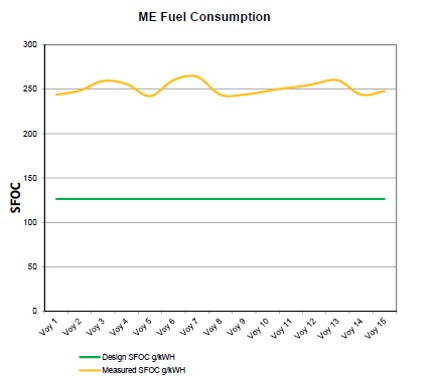
- Other systems that should be addressed on an Energy Management System are:
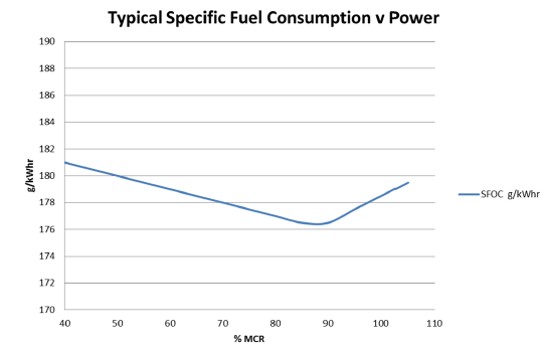
- A drop of 3.5g/kWh on MGO between 45% and optimum 90% power
- 1 engine running at 900kW instead of 2 engines running at 450 kW
- Savings 60 US$ per day on (HFO)
- Savings 50 US$ per day on Lube oil
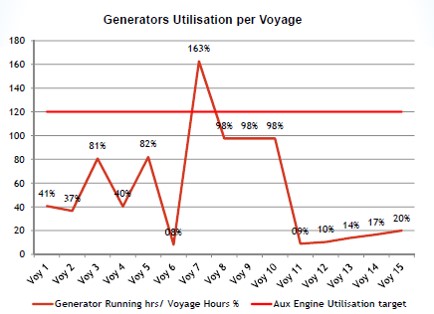

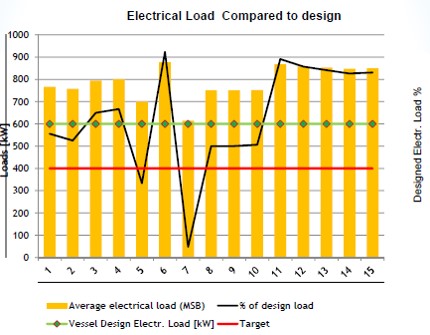
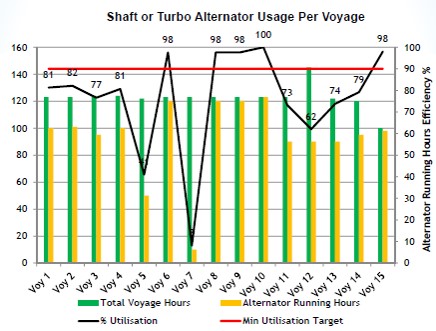
An Energy Management System comprehends a major ally towards Emissions Control and reduction.
Energy Emissions Operational Index
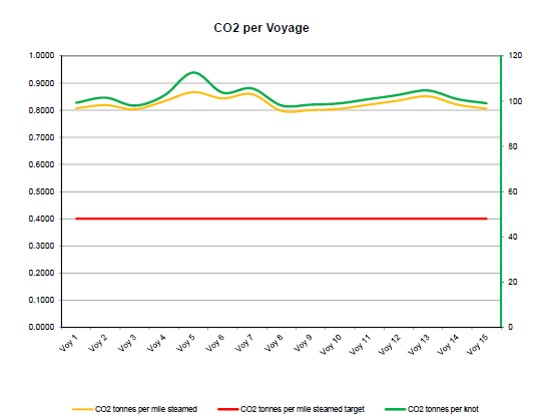
Emissions Performance
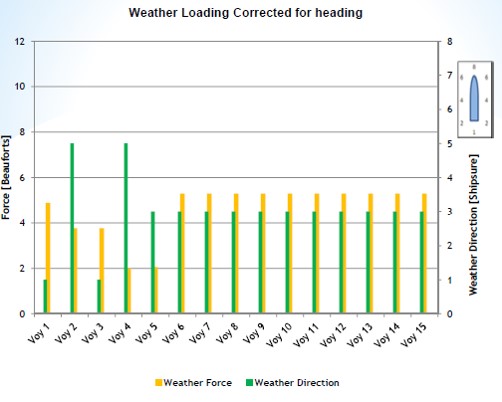
Vessels speeds: Ship speed optimisation based on fuel costs, weather forecast, virtual arrival and freight rates are easily estimated on BOEM-S. Checkpoints of then created, to help crews to check the voyage development.
Dynamic Trim: Trim is dynamically adjusted by the crew at any draft and weather condition. Using VEEO’s interactive interface, the crew can adjust the trim to its optimal angle through observation of fuel consumption and vessel speed and RPM.


1 comments on “Case Studies and Ship Performance Monitoring”
The ADMIRALTY Vector Chart Service (AVCS) the world’s leading digital maritime chart service, with over 15,750 official Electronic Navigational Charts (ENCs), helps bridge crews navigate safely and efficiently whilst meeting Flag and Port State requirements.